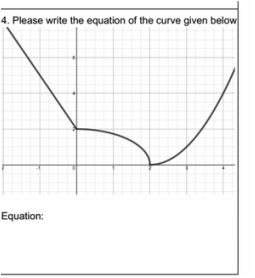
To look at this graph you must be thinking someone was crazy. In a sense they were, you have to use three equations to make a graph like this. You have to us neagtive x squared plus 2. Then you have to use the square root of -x squared plus 2 squared. Then finally you have to use (x squared minus 2) squared.
The object of this activity was to see if the basketball would make it in or not. I made this diagram by using GeoGebra. It took a minute to figure out even after watching the video, haha. Anywho we had to see if the ball would make it into the hoop or not. By the diagram the ball appears to miss the hoop, but not by much. Maybe if we're lucky the ball will bounce off the back board.
In this activity I had to find the inverse function of y equals x squared. To find the inverse I had to switch the y and the x. My observations concluded that the graph flipped on its side. In the bottom picture I folded the graph along the dotted line to see if the graphs lined up. As you can see they are slightly off, this is because my dotted line was off centered. |
Amber CI am in Pre Calculus and this is my blog. Archives
April 2015
Categories |